
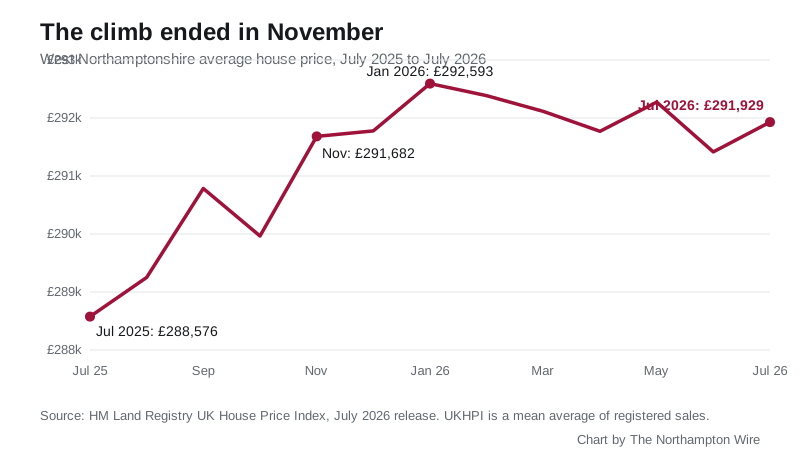
The July average of £291,929 is up just £247 since November. Flats fell 1.8% in a year, the only type losing value, and June was revised down £1,339.
The average home in West Northamptonshire sold for £291,929 in July, according to figures HM Land Registry published on 16 September. That is £3,353 more than a year earlier, a rise of 1.2%.
Almost all of that rise is old news. Of the £3,353 gained over the year, £3,106 had already happened by last November. The eight months since have added £247.
A market parked since autumn
Every month from November to July has landed inside a band £1,178 wide, between June’s £291,415 and January’s £292,593. On the current figures, January 2026 is the highest monthly average the district has recorded. July sits £664 below it.
Annual growth tells the same story from a different angle. It was 5.2% as recently as April 2025 and 2.0% in June on the revised figures. July’s 1.2% is the district’s weakest annual rise since April this year.
England as a whole averaged £293,479 in July, up 1.1% on the year. West Northamptonshire sits £1,550 below that, and £49,655 above the East Midlands average of £242,274.
The numbers behind it keep shrinking
The index is built from completed sales, and the Land Registry keeps adding late-registered sales to months it has already published. Recent revisions have all pointed the same way: down.
- June was first published on 19 August at £292,754, an annual rise of 2.5%. The July file cuts it to £291,415, an annual rise of 2.0%. That is £1,339 removed from a figure already in print.
- May has now been published three times, at three different values: £292,495 in the May file, £293,565 in the June file, and £292,274 now.
- Our report on the June figures called May the district’s record month, which was true on the file as published. The revisions have taken that record away and handed it to January 2026.
The first release of any month is provisional, and this is what that means in practice. A month can move by more than £1,000 after publication.
Flats are falling again
The four property types are having very different years, and one of them is going backwards.
| Property type | Average price | Change on July 2025 |
|---|---|---|
| Semi-detached | £285,016 | +2.0% |
| Terraced | £235,586 | +1.8% |
| Detached | £472,440 | +0.6% |
| Flat or maisonette | £139,838 | -1.8% |
Flats are the only type losing value, and the fall extends a long slide. The district’s flat average peaked at £148,147 in December 2022 and is now £8,309, or 5.6%, below that.
The first-time buyer average is £242,144, up 1.5% on the year.
Every neighbour except Rugby is growing faster
All figures below come from the same July index, so they are measured the same way.
| Area | Average price | Change on July 2025 |
|---|---|---|
| Cherwell | £356,935 | +4.7% |
| Bedford | £333,824 | +3.9% |
| Milton Keynes | £330,419 | +2.6% |
| North Northamptonshire | £257,807 | +2.9% |
| West Northamptonshire | £291,929 | +1.2% |
| Rugby | £272,696 | -3.5% |
| East Midlands | £242,274 | +1.9% |
Rugby is the outlier in the other direction: prices there have fallen 3.5% in a year.
What it means for you
If you are selling. A market that has moved £247 in eight months is neither rising to meet an ambitious asking price nor falling away underneath a fair one. Which of the four types your home belongs to matters more than the headline: a semi has gained 2.0% in a year and a flat has lost 1.8%.
If you are buying a flat. Prices are 5.6% below the December 2022 peak and fell over the last year, while every other property type rose.
If you are comparing with an estate agent’s figure. UKHPI is a mean average, not a median, and it is built from completed, registered sales rather than asking prices. A handful of expensive sales pull a mean upward in a way they would not pull a median.
If you want the town rather than the district. The index area is the whole unitary authority, from Northampton out to Daventry, Towcester, Brackley and the villages. Northampton’s own postcodes sit below it. Our Northampton house prices page carries both figures and explains the gap.
One caveat on sales counts. The Land Registry publishes them well behind prices, and they climb for months as sales are registered: April 2026 was shown as 311 sales in the June file and 332 now. The newest published count, 316 for May, will rise the same way, so it cannot yet be compared with the 500 to 620 sales a month recorded through 2025.
New housing supply shapes where this market goes next, and the district’s Local Plan is now under a Government direction. We track what gets built on our Northampton planning news page.
Sources
- UK House Price Index, West Northamptonshire, July 2026, HM Land Registry, published 16 September 2026
- UK House Price Index for July 2026, HM Land Registry and Office for National Statistics, 16 September 2026
Have your say